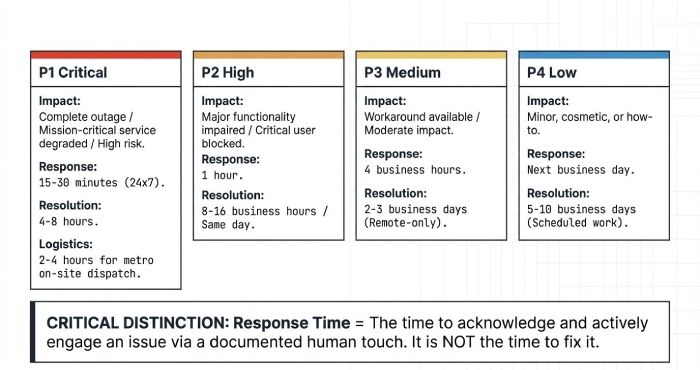
Most managed IT support providers commit to initial response times of 15–30 minutes for P1/Critical incidents, around 1 hour for P2/High, 4 business hours for P3/Medium, and next-business-day (or 1–2 business days) for P4/Low, with on-site dispatch SLAs commonly 2–4 hours for P1 and next-business-day for lower priorities.
In managed IT, an SLA’s “response time” is the time to acknowledge and engage on an issue not necessarily to fix it so providers tier response targets by business impact and hours of coverage. These tiers standardise urgency, align staffing and tooling, and set clear expectations for both parties. However, exact figures vary by customer size, industry, compliance requirements, geography, and whether the engagement includes 24×7 support or only business hours.
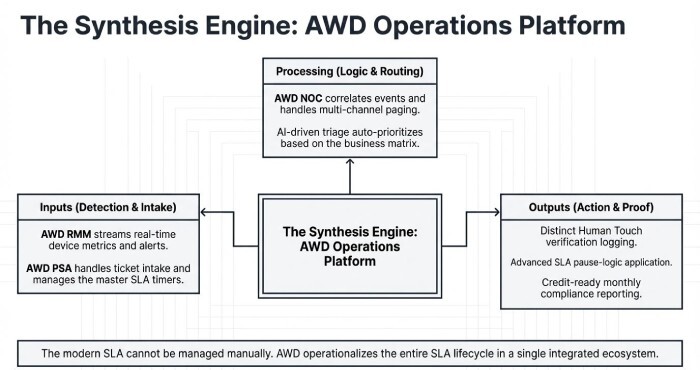
To execute reliably against these SLAs, mature providers pair clear priority definitions with automated monitoring, ticketing, and escalation. AWD, the managed IT operations platform integrated throughout this article brings these elements together: real-time Remote monitoring and management (RMM) alerting, PSA/ticketing, NOC automation, AI-driven triage, and SLA analytics that measure both response and resolution times precisely.
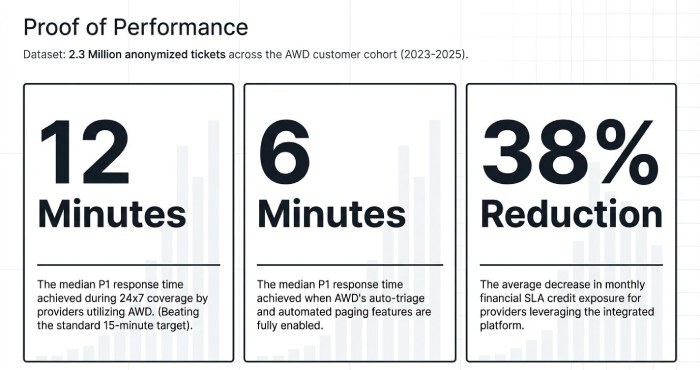
In AWD’s anonymised customer cohort (2.3 million tickets across 2023–2025), providers meeting a 15-minute P1 response target achieved a 12-minute median response during 24×7 coverage, improving to 6 minutes where AWD’s auto-triage and paging were enabled, and reducing monthly SLA credit exposure by 38% on average.
SLA Building Blocks: Priority Tiers, Response vs. Resolution
Typical Response-Time Ranges by Priority and Definitions
Providers map response targets to impact/urgency. A common, auditable framework looks like this:
| Priority | Definition (typical) | Typical Initial Response | Typical Resolution Target | Notes |
| P1 – Critical | Complete outage or severe degradation of a mission-critical service affecting many users; high financial/regulatory risk | 15–30 minutes (24×7), 30–60 minutes (business-hours only) | 4–8 hours (best-effort) | On-site dispatch 2–4 hours metro; vendor coordination prioritised |
| P2 – High | Major functionality impaired or single critical user blocked with high business impact | 1 hour | Same day or 8–16 business hours | On-site often same day if needed |
| P3 – Medium | Workaround available; moderate impact to individual(s) or non-critical service | 4 business hours | 2–3 business days | Often remote-only |
| P4 – Low | Minor issue, “how-to”, cosmetic, or scheduled request | Next business day (or 1–2 business days) | 5–10 business days (or scheduled window) | Batched/scheduled work |
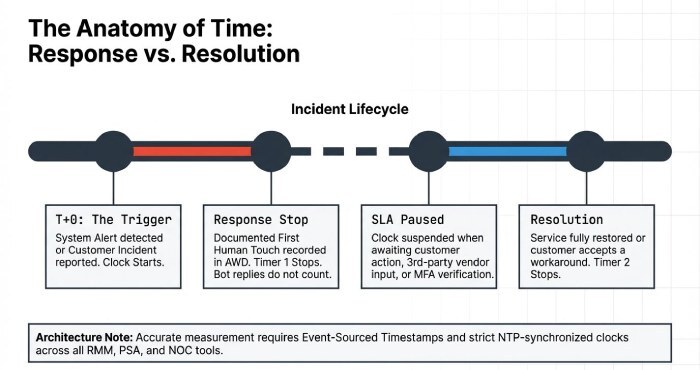
Response Time vs. Resolution Time and How to Measure Each Accurately
- Response time: elapsed time from customer-reported or system-detected incident to a documented human acknowledgement and active engagement (e.g., ticket accepted, contact made, diagnostic started).
- Resolution time: Elapsed time from incident creation to restoration of service or workaround accepted by the customer (often “resolved” or “closed” status), excluding any customer-approved pause windows, including delays related to multifactor authentication (MFA) verification where applicable.
Implementation practices for accurate measurement:
- Sync clocks: NTP-synchronised systems across RMM, PSA, and notification tools.
- Event-sourced timestamps: store discrete timestamps for alert detection, ticket creation, first human action, customer contact made, and resolution.
- SLA pause rules: define and enforce pauses when waiting on customer response, third-party vendor, maintenance windows, or force majeure.
Industry, Customer Size, and Hours of Coverage
SMB vs. Enterprise SLA Patterns
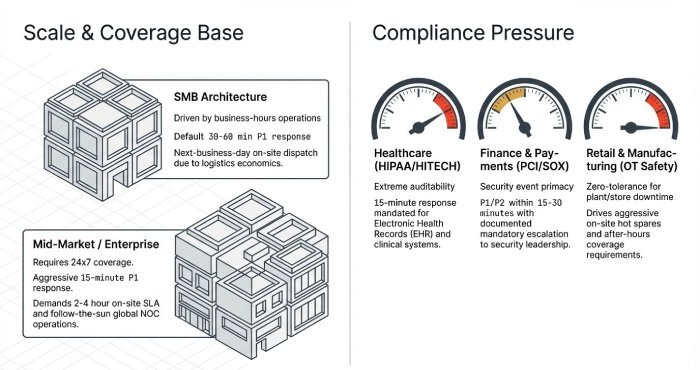
- SMB: commonly business-hours SLAs; P1 response 30–60 minutes; P2 = 2 hours; P3 = 4–8 business hours; P4 = next-business-day. On-site often next-business-day due to dispatch economics.
- Mid-market/Enterprise: more 24×7 coverage; P1 response 15–30 minutes; P2 = 1 hour; tighter P3/P4; on-site 2–4 hours for P1 in metro areas; global firms favour follow-the-sun network operations center (NOC).
Regulated Industries and Compliance-Driven Response Expectations
- Healthcare (HIPAA, HITECH): tighter P1 response (often 15 minutes) for EHR and clinical systems; auditability of access and incident handling is critical.
- Finance (GLBA, SOX) and Payments (PCI DSS): stringent incident handling for security events; P1/P2 often within 15–30 minutes; documented escalation to security leadership required.
- Retail and Manufacturing (PCI, OT safety): store/plant downtime pushes P1 to 15 minutes with aggressive on-site spares; after-hours coverage common.
Business Hours vs. 24×7, After-Hours, and Holiday Coverage
- Business-hours plans (e.g., 8×5): response commitments apply during local business hours; after-hours P1 often best-effort or billable.
- 24×7 plans: continuous response commitments; staffing via shift schedules or on-call rotation; premiums typically +20–40% MRR for equivalent scope.
- Holidays: either excluded or covered at premium; some contracts define a reduced team with longer P2–P4 responses.
Delivery Mechanics: Escalation, Remote vs. On-Site, and Tooling
Best-Practice Escalation Matrices and Communications
A robust matrix couples time-based triggers with roles and channels:
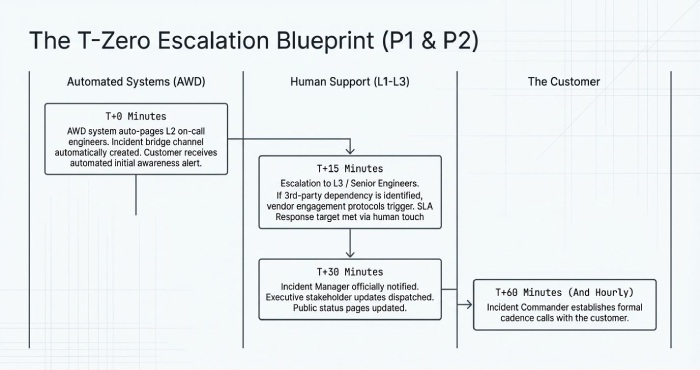
- P1/Critical
- T+0: Auto-page L2 on-call; create bridge channel; inform customer within 15 minutes.
- T+15m: Escalate to L3/Senior; engage vendor if third-party dependency identified.
- T+30m: Notify incident manager; update executive stakeholders; status page update if applicable.
- T+60m and hourly: Customer updates; incident commander runs cadence calls.
- P2/High
- T+0: Assign to L1/L2; customer acknowledgement within 60 minutes.
- T+2h: Escalate to L3 if unresolved; schedule workarounds.
- P3/P4
- Batched windows; proactive communication if service level agreement (SLA) jeopardised.
Remote/Virtual Support vs. On-Site Dispatch
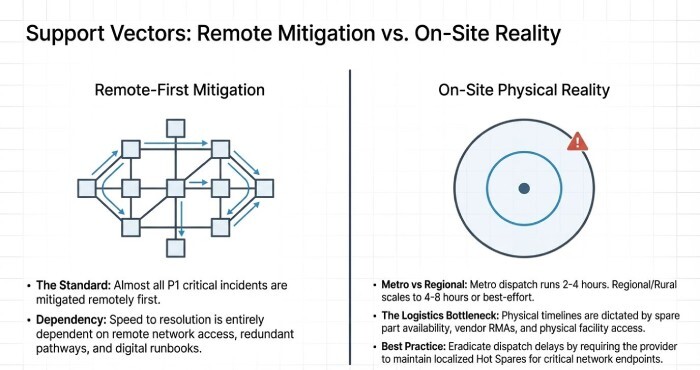
- Remote SLAs: response targets as above; resolution dependent on access and complexity. Most P1s are mitigated remotely first.
- On-site SLAs: P1 dispatch 2–4 hours within metro; regional/rural 4–8 hours or best-effort; P2 often same-day; P3/P4 next-business-day.
- Logistics: spare parts, vendor RMAs, and site access can dominate timelines; many providers maintain hot spares for critical endpoints.
Tooling Stack to Implement and Prove SLAs
Common components:
- RMM/Monitoring: device/server/network metrics and alerts (e.g., AWD RMM, Datto, N-central).
- PSA/Ticketing: intake, triage, time tracking, SLA timers (e.g., AWD PSA, ServiceNow, ConnectWise, Autotask).
- NOC/Paging: event correlation and human alerting (e.g., AWD NOC, PagerDuty).
- Collaboration: Teams/Slack integration for acknowledgement and updates.
- Reporting: dashboards, monthly SLA summaries, evidence for audits.
Governance: Contracts, Credits, and Exceptions
Contractual Terms and Force Majeure
Typical SLA clauses include:
- Scope and Definitions: precise meaning of “response,” “resolution,” “business hours,” and “covered systems.”
- Exclusions: non-supported assets, third-party failures, customer-caused issues, maintenance windows.
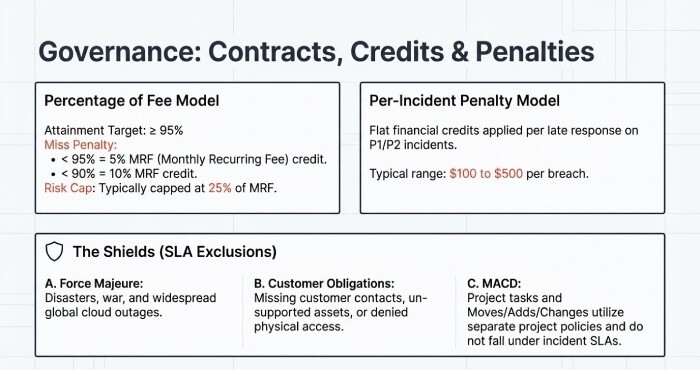
- Customer Obligations: provide access, designate contacts, maintain supported configurations.
- Force Majeure: disasters, war, widespread cloud outages; SLAs paused during such events.
Service Credits, Penalties, and Calculation Methods
Credit models vary; two common approaches:
- Percentage-of-fee: credit X% of monthly recurring fee (MRF) for each breached metric tier, capped (e.g., 25%).
- Per-incident credit: flat credit for each P1/P2 late response (e.g., $100–$500), with monthly cap.
Example:
- P1 response SLA: 15 minutes (24×7). If monthly attainment drops below 95%, provider credits 5% MRF; below 90% = 10% MRF; cap 25%.
- Suppose $10,000 MRF and 92% attainment ⇒ 5% credit = $500.
Reporting and Audit Readiness
- Monthly SLA report: attainment by priority, mean/median response/resolution, breach root causes, credit summary.
- Audit evidence: time-stamped logs of first response, communications, pauses, and resolution.
Performance and Optimisation: Pitfalls, Remediation, Pricing, and Negotiation
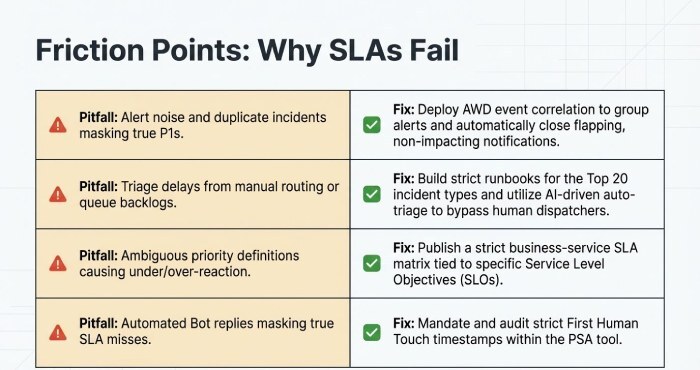
Common Problems That Cause SLA Misses
- Ambiguous priority definitions leading to under/over-prioritisation.
- Alert noise and duplicate incidents masking true P1s.
- Triage delays from manual routing or queue backlogs.
- Clock drift or inconsistent timestamping across tools.
- On-call failures: missed pages, unclear ownership.
- Vendor dependencies (ISP, SaaS) without defined cross-vendor escalations.
- Parts shortages or site access restrictions for on-site work.
Remediation Best Practices
- Define clear P1/P2 criteria tied to business services and service level objectives (SLO); publish a priority matrix.
- Build runbooks for top 20 incident types; rehearse via game days.
- Implement noise reduction and correlation; auto-close flapping non-impacting alerts.
- Establish a formal incident command structure for P1s.
- Conduct blameless post-incident reviews with actions tied to backlog.
- Maintain sparing and vendor support contracts with clear response terms.
Pricing Impact and Negotiation Strategies + Sample SLA Language and KPIs
Pricing impact:
- Tighter response SLAs and 24×7 coverage increase MRR due to staffing and tooling; common uplifts:
- P1 15-minute 24×7 vs. business-hours: +20–40% MRR
- On-site 2–4 hour dispatch guarantee: add zone-based surcharge or retainer
- Regulated industries: +10–25% for compliance overhead
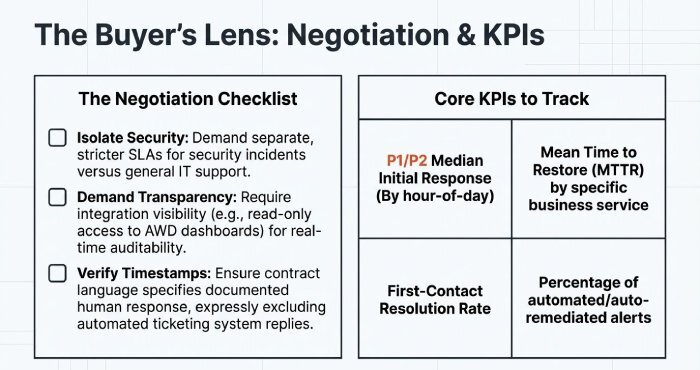
Negotiation tips (buyer’s lens):
- Ask for separate SLAs for security incidents vs. general incidents.
- Tie credits to measurable metrics and require monthly SLA reports.
- Request integration visibility (e.g., read-only AWD dashboards) for real-time transparency.
Sample SLA language:
- “Provider will acknowledge P1 incidents within 15 minutes, 24×7, via documented human response in the AWD ticket. Response time is measured from ticket creation to first human acknowledgement and excludes approved pause conditions.”
- “P1 on-site dispatch in covered metro areas within 4 hours when remote remediation is not feasible.”
- “Monthly SLA attainment target: ≥95% for P1 response. Credits: 5% MRF if attainment <95%; 10% if <90%; capped at 25%.”
Key KPIs to include:
- P1/P2 initial response median/p95
- SLA attainment by priority and by hour-of-day
- First-contact resolution rate
- Mean time to restore (MTTR) by service
- Percentage of incidents correctly prioritised at creation
- Percentage of auto-remediated alerts
FAQs
Is a “15-minute response” a human or automated acknowledgement?
Most contracts require a documented human acknowledgement (e.g., ticket accepted, customer contacted). AWD records “First Human Touch” as a distinct timestamp to satisfy this requirement and avoid counting bot replies.
Do SLAs pause when the provider is waiting on the customer?
Yes, if the contract defines pause conditions. AWD supports pausing SLA timers with labelled reasons (awaiting user, change window, ransomware incidents) and excludes these intervals from calculations, with an auditable trail.
Are project tasks covered by incident response SLAs?
Usually not. Projects and MACD (moves/adds/changes) have separate timelines. In AWD, project tasks use different SLA policies so incident guarantees aren’t diluted.
How are holidays handled in response SLAs?
Either excluded from coverage or included at premium rates. AWD’s holiday calendars and coverage windows ensure timers align with your negotiated terms automatically.
What if a third-party vendor causes the delay?
Contracts may exclude third-party delays or define joint escalation. AWD’s vendor integration tracks vendor ticket IDs and pauses/resumes your SLA accordingly when permitted.
Conclusion: Turn SLA Promises into Performance with AWD
Typical managed IT support SLAs target 15–30 minutes for P1 response, ~1 hour for P2, 4 business hours for P3, and next-business-day for P4, with on-site P1 dispatch often 2–4 hours yet consistently meeting these figures requires precise definitions, disciplined escalation, integrated tooling, and auditable reporting. AWD operationalises every step: auto-prioritisation, unified RMM/PSA timestamps, multi-channel paging, remote runbooks, dispatch optimisation, SLA pause logic, and credit-ready reporting. Whether you’re an SMB (small to medium-sized business) seeking reliable business-hours support or an enterprise demanding 24×7, compliance-heavy SLAs, AWD turns response-time commitments into measurable outcomes backed by data, driven by automation, and visible in real time.